Development of a low-cost smartphone fluorescence microscope
As a frame to support a smartphone or tablet for fluorescence viewing, we adapted a do-it-yourself microscope design used widely for non-fluorescent imaging3,4. This frame consisted of a plexiglass platform to hold a smartphone (or tablet) atop the specimen (Fig. 1a). A second
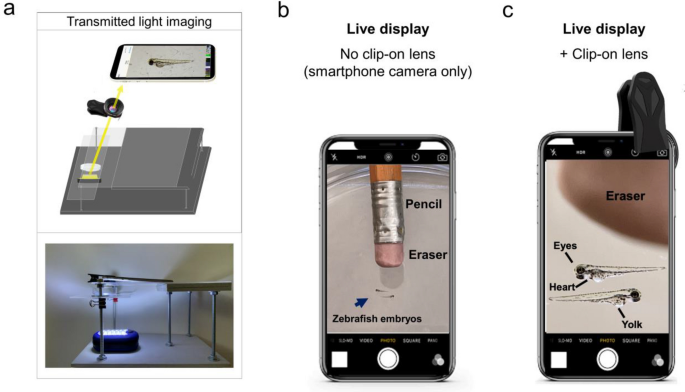
Live view of non-fluorescent specimens using the glowscope frame. (a) Illustration shows the light path for transmitted light viewing. Components shown include the smartphone, clip-on lens (black), glowscope frame (gray), stage and viewing platform (transparent), petri dish containing a specimen, and a LED work lamp positioned under the stage and viewing platform. (b) Image view using a smartphone camera without the clip-on lens shows zebrafish embryos (blue arrow, 3 dpf). A standard pencil (eraser side) is shown as a size reference. (c) Image view using the additional clip-on lens shows the same zebrafish embryos and pencil eraser seen in panel (b). Images shown in panels (b–c) are native magnification (not stretched) as seen on live-view, acquired using an Apple iPhone 12 Pro with 1x (middle magnification) lens, 6 × digital zoom.
plexiglass platform positioned below the smartphone lens served as a stage to hold the specimen. The adjustable height of the plexiglass stage ensured the ability to focus on the specimen. Wood or composite boards, nuts, bolts, and washers held the plexiglass platform and stage in place. For non-fluorescent imaging, a battery-powered LED work lamp positioned below the specimen provided additional light when ambient room lighting was insufficient (Fig. 1a).
To increase magnification and resolution beyond the smartphone or tablet alone, an additional ‘clip-on’ macro lens was clamped over the phone or tablet camera (Fig. 1a, c). The additional clip-on lens used in this study provided approximately fivefold magnification (Fig. 1b–c). This magnitude depended on the distance the specimen was placed from the clip-on lens. When viewing embryonic zebrafish (2–4 days post-fertilization), which are roughly equivalent to the length of a pencil eraser (2–3 mm in length), the increased magnification and image resolution made features of the zebrafish body plan easily observed. For example, anatomical structures including the eye, heart, yolk, and tail were easily observed on the live display using the clip-on lens (Fig. 1c). Using USAF test targets, we measured 9.8 µm resolution using an iPhone 11 camera with the added clip-on lens. This corresponded to significant improvements to image resolution and anatomical detail in live view or after image acquisition. After images were captured and digitally stretched to further magnify on a smartphone or laptop screen, the clip-on lens easily resolved anatomical structures and even individual pigment cells (melanocytes). In comparison, without the clip-on lens, these same features were difficult or impossible to view (Supplementary Fig. S1).
To equip the smartphone scope with fluorescence imaging capability, we next added fluorescence light sources and filters. To view specimens with green fluorescence, we turned off the LED work light and instead used a blue LED headlamp or flashlight (Fig. 2a). We used theater stage lighting filters to block the blue light from reaching the camera lens. To do so, we placed the filter immediately underneath the clip-on lens and smartphone (Fig. 2a). These inexpensive ‘emission filters’ reduced fluorescence background from the blue flashlight while permitting the green fluorescence from the specimen to pass through the filter and reach the camera. We initially obtained a sample-pack of theater stage lighting filters with a wide range of spectral properties. After testing numerous filter color options, we found that the combination of
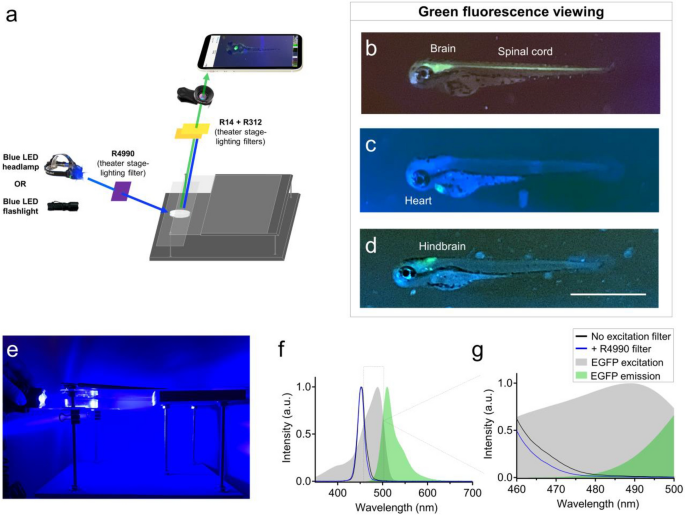
Use of recreational LED flashlights and theater stage lighting filters for smartphone green fluorescence microscopy. (a) Schematic of components used for green fluorescence viewing on the glowscope. (b–d) Representative fluorescence images of transgenic zebrafish embryos (3–4 dpf, lateral views) expressing green fluorescence in cell-type specific patterns. Reporter lines viewed include Tg(nkx2.2a:memGFP) (b), Tg(myl7:EGFP) (c), and Tg(phox2b:EGFP) (d). (e) Image shows the glowscope in use for green fluorescence viewing. (f–g) Plots show the blue LED flashlight emission wavelength (black and blue lines, measured using a Vernier spectrometer) in comparison to the excitation profile of EGFP (gray, obtained from www.fpbase.org). The dashed box region in panel (f) is further magnified in panel g to show the effect of the R4990 filter with greater detail. Images in panels (b–d) were acquired using an Apple iPhone XR.
Rosco #14 and #312 stage-lighting filters effectively blocked blue light while enabling robust green fluorescence signal to transmit through to the camera (Fig. 2a). To test the functionality of this setup, we used transgenic zebrafish reporter lines that expressed enhanced green fluorescent protein (EGFP) in subsets of tissues or neural cells. For example, the fluorescence setup easily detected brain and spinal cord fluorescence in Tg(nkx2.2a:memGFP) embryos, cardiac tissue in Tg(myl7:EGFP) embryos, and had adequate sensitivity to detect EGFP expressed in a sub-region of the embryonic hindbrain in Tg(phox2b:EGFP) embryos (Fig. 2b–d). To further reduce background fluorescence and enhance the signal:noise ratio, we added Rosco filter 4990 positioned between the blue LED flashlight and the specimen (Fig. 2a). Anecdotally, this ‘excitation’ filter darkened the otherwise blue-green background with negligible loss of green fluorescence emitted and transmitted to the smartphone camera and viewed image. Using a Vernier spectrometer, we found that the added excitation filter slightly reduced the intensity of LED fluorescence between 460 – 500 nm (Fig. 2f–g). This may explain the reduced blue background fluorescence on the viewed images when R4990 excitation filter was used. Though this additional excitation filter is not necessary for green fluorescence viewing, it can effectively reduce background and improve the signal:noise ratio when viewing specimens with dim fluorescence. To further assess the profile of the blue LED headlamp, we measured current draw at 2.5 A and light intensity at 492 lx. These measurements are within the range that warrants prevention of prolonged and direct eye exposure (see ‘Discussion’).
We also tested LEDs and stage lighting filters for viewing red fluorescence (Fig. 3). In place of a blue flashlight, we instead used a green LED flashlight. As an emission filter positioned underneath the lens, we used Rosco stage lighting filter #19 to block green light while permitting red fluorescence to pass through to the camera lens (Fig. 3a). In our hands, this emission filter worked best when doubled up, and provided clear fluorescence viewing of transgenic zebrafish lines expressing red fluorescent proteins. As examples, this setup effectively illuminated brain and spinal cord features of Tg(olig2:DsRed) embryos, heart fluorescence in Tg(myl7:mCherry) embryos, and head and jaw skeleton (cranial neural crest) fluorescence in Tg(sox10:mRFP) embryos (Fig. 3b–d). The LED flashlight we used advertised 530 nm LED excitation, which among the fluorophores we used, aligned best with the spectral properties of DsRed. In our hands, the green flashlight and Rosco stage lighting filters in fact paired best with DsRed, but somewhat less well with the red-shifted fluorescent proteins mRFP and mCherry (Fig. 3b–d). Background fluorescence and signal:noise ratio were marginally improved by covering the flashlight with Rosco filters #88 and #89 (Fig. 3a). This excitation filtering reduced fluorescence intensity at wavelengths between 540 – 580 nm (Fig. 3f–g) and may explain the decreased background fluorescence observed in acquired images when the excitation filters were used. Although the excitation filters #88 and #89 improved image quality and detection of dim fluorescence, they were not necessary for red fluorescence imaging in our hands.
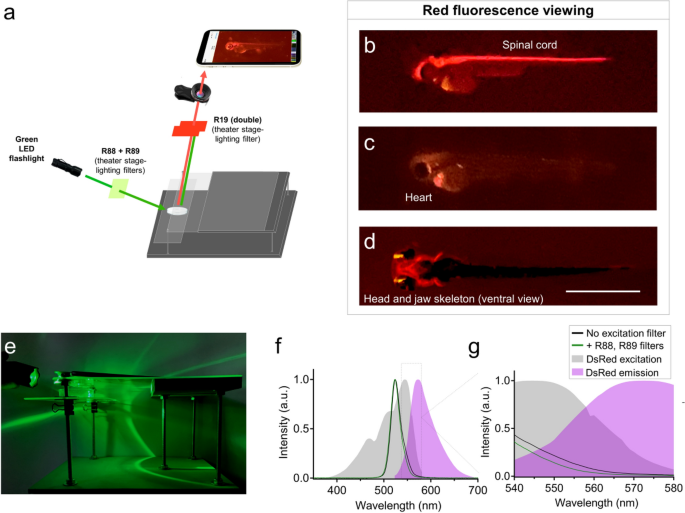
Glowscope detection of red fluorescent proteins. (a) Schematic of components used for red fluorescence viewing on the glowscope. In comparison to green fluorescence viewing, flashlight and filters are changed, but the remainder of the glowscope is unchanged. (b–d) Representative fluorescence images of transgenic zebrafish embryos (3–4 dpf, lateral views) expressing red fluorescence in cell-type specific patterns. Reporter lines viewed include Tg(olig2:DsRed) (b), Tg(myl7:mCherry) (c), and Tg(sox10:mRFP) (d). Scale bar is 1 mm. (e) Image shows the glowscope in use for red fluorescence viewing. (f–g) Plots show the green LED flashlight emission wavelength (black and green lines, measured using a Vernier spectrometer) in comparison to the excitation profile of DsRed (gray, obtained from www.fpbase.org). The dashed box region in panel (f) is further magnified in panel (g) to show the effect of the R88 + R89 filters with greater detail. Images in panels (b–c) were acquired using an Apple iPhone XR and panel (d) was acquired using an iPhone 12 Pro.
Summary of glowscope components, cost, and smartphone compatibility
The parts needed to convert a smartphone or tablet into a fluorescence microscope are summarized in Fig. 4. At the time of our testing and manuscript preparation, the necessary parts were acquired for a total of $30–50 USD per individual glowscope (Fig. 4a). Wood and plexiglass were cut and drilled with basic tools. Theater stage lighting filters were purchased in large sheets and cut to size, resulting in a cost of less than $0.10 USD per unit filter for this application. Blue and green LED flashlights were readily available from online retailers as sold for tactical, hunting, and fishing applications. We tested numerous options and found that those with blue rather than UV light worked best for viewing green fluorescent protein. Our preferred light source was a multi-color tactical flashlight with both blue (454 nm) and green (530 nm) colors, which retailed for $20 USD at the time these studies were performed. By contacting sellers directly and purchasing in bulk, we arranged for direct purchasing at wholesale cost (~ 50% discount). Additional details for parts and build instructions can be found in the Supplementary Methods.
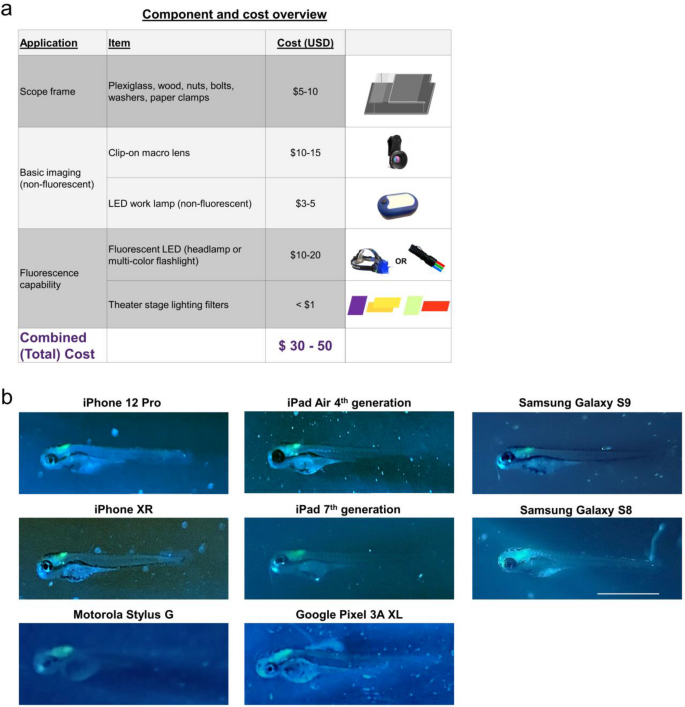
Summary of glowscope components and smartphone compatibility. (a) Table shows the basic components and costs (at the time of this study) in US Dollars. (b) Representative images of Tg(phox2b:EGFP) zebrafish embryos demonstrate compatibility with all devices tested, but subtle differences between various tablets and smartphones used for testing. Scale bar is 1 mm.
To assess glowscope compatibility with different camera devices, we next tested the fluorescence viewing capabilities using various smartphone and tablet models to detect green fluorescence in Tg(phox2b:EGFP) embryos. Of the green reporter lines initially tested (Fig. 2b–d), Tg(phox2b:EGFP) was the most challenging to view because the green fluorescence expression is only present in part of the embryonic hindbrain. All devices tested, including Samsung, Apple, Google, and Motorola phones and tablets, detected the subtle green fluorescence in the hindbrain (Fig. 4b). Newer devices generally acquired fluorescence images with brighter green intensities in comparison to the background fluorescence, but these differences were subtle. We conclude that use of the newest smartphone or tablet models is not necessary for glowscope fluorescence viewing.
Glowscope determination of embryonic zebrafish heart rate and rhythmicity
We next tested the ability of the glowscope to detect changes to heart rate and rhythmicity using green fluorescence imaging in embryonic zebrafish. Because the Tg(myl7:EGFP) reporter expresses green fluorescence in cardiomyocytes, the glowscope and live smartphone display made the beating heart chamber movements clearly observable over time (Fig. 5a). To determine if the imaging setup was capable of detecting drug-induced changes to heart rate, we performed pre- and post-viewing before and after 30 min treatment with astemizole (Fig. 5b). Formerly branded as Hismanal, astemizole was commonly used as an antihistamine allergy medication, but was pulled from the market in 1999 because it caused rare but fatal heart complications such as long QT syndrome, cardiac arrythmias, and life-threatening tachycardia15. These human side effects were caused because astemizole blocks ERG-type K+ channels involved in repolarizing the cardiac action potential16 in addition to its antihistamine mode of action. Previous studies have demonstrated that astemizole treatment causes dose- and time-dependent bradycardia followed by eventual atrioventricular 2:1 block (arrythmia) and cardiac arrest in zebrafish embryos17. Using smartphone fluorescence viewing of Tg(myl7:EGFP) zebrafish in real-time, we detected a significant reduction to heart rate following 30 min astemizole treatment (Fig. 5b–c). This drug treatment-induced bradycardia was similarly observed while recording the video (live view), by observing the recorded video in playback on the smartphone display screen, or by transferring the video recording to view on a laptop display (Fig. 5d).
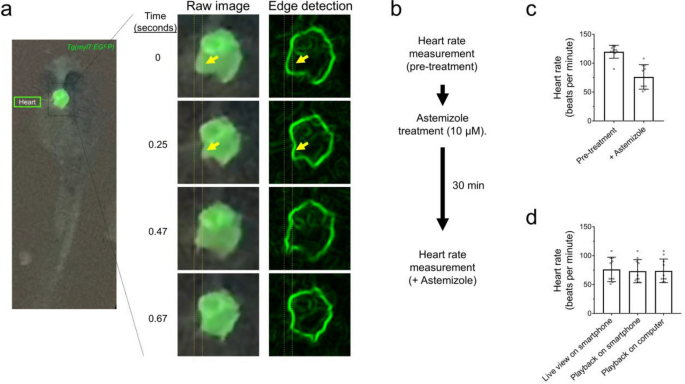
Glowscope detection of drug-induced changes to heart rate in transgenic zebrafish embryos. (a) Left fluorescence image shows GFP expression in the heart of a Tg(myl7:EGFP) embryo (ventral view). The boxed region is further magnified in the middle column, which from top to bottom show chamber movements across a video acquired on an iPhone 11 Pro smartphone. To aid viewing of chamber movements, these videos were transferred to a laptop, opened in ImageJ (free software), and processed using edge detection, which outlines the walls of the chambers. Static arrows highlight heart chamber movements. (b) Flow chart of the pre- and post-imaging of zebrafish heart rate in response to astemizole treatment (10 µM). (c) Plots show the average heart rate of zebrafish embryos prior to and after treatment with astemizole. n = 10 animals measured in one independent experiment, P = 0.0002, paired two-tailed t-test. (d) Summary of measurements conducted while recording the video in real time (left bar), viewed on the smartphone after recording the video (middle bar), or viewed on a laptop (right bar). N = 10 animals measured in one independent experiment, P = 0.942, one-way ANOVA. For panels (c–d), scatter plot points represent individual zebrafish (heart) rate measurements and error bars represent standard deviation.
To further test the capabilities and limitations of smartphone fluorescence, we next assessed the ability to separately resolve atrium and ventricle chamber contractility rates, which we predicted could be beneficial to detect cardiac arrythmias. On most video recordings we captured, individual chamber movements were clearly visible on some but not all embryos and pushed the limitations of the glowscope. To enhance the clarity and detection of chamber movements, we transferred the smartphone videos to a computer running the freely available software ImageJ (also known as Fiji). Within Fiji, the ‘find edges’ command provided a simple means to outline the edges of the heart chambers and their movements over time (Fig. 6a–c). By monitoring fluorescence intensity changes specifically within a small region of interest (ROI) box, we detected oscillating heart chamber wall movements in and out of the ROI over time (Fig. 6c–d). This method provided clear separation of atrial and ventricular contractility rates using the smartphone device (Fig. 6c–d). Plots generated from videos recorded before and after astemizole treatment displayed notable differences. Prior to treatment, both chambers beat rapidly and in an alternating pattern. In comparison, 30min treatment with a high dose of astemizole (30 µM) caused severe bradycardia and arrythmia, as evidenced by the ventricle stalling during every other atrium beat (Fig. 6d).
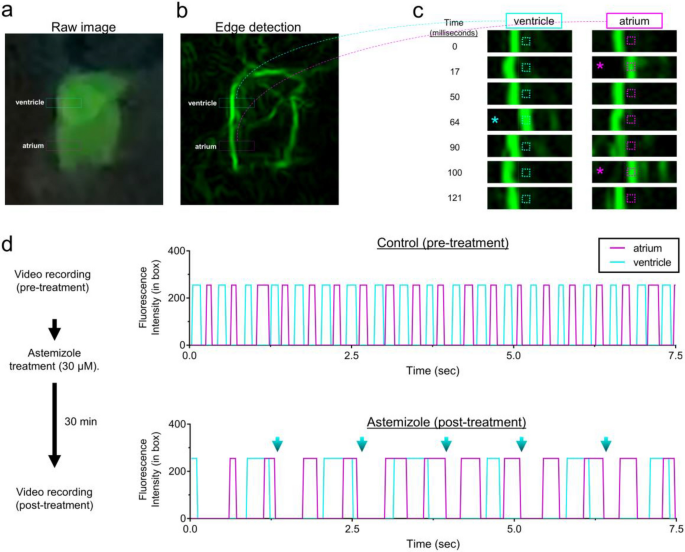
Glowscope detection of drug-induced cardiac arrythmia. (a–b) Still images from a glowscope video (acquired on an iPhone 11 Pro) show atrium and ventricle chambers in a 3 dpf Tg(myl7:EGFP) zebrafish embryo. Images show either the raw (unedited) view of heart fluorescence directly from smartphone video recording (a) or a processed view of the same heart after edge detection was performed on a computer using Fiji (b). Blue and magenta rectangles show the regions of ventricle and atrium chambers used for high-magnification viewing and analysis in (c–d). (c) Images show a timecourse (top to bottom) of ventricle (left) or atrium (right) chamber movements detected by the glowscope (corresponding to boxed regions in panel b). The small, dash-boxed regions of interest were used to monitor fluorescence intensity changes over time. Asterisks highlight frames where the heart chamber wall has moved into the region of interest with respect to the prior frame. (d) Graphs of fluorescence intensity vs. time plotted for atrium and ventricle chamber reveals oscillating chamber movements. Measurements within the same embryo (N = 1) were separately acquired and analyzed before (upper) and after astemizole treatment (lower). The maximum fluorescence intensity (in arbitrary units) within the dash-boxed region of interest shown in panel (c) was obtained and plotted for each time frame of the video recording, resulting in a fluorescence peak each time the chamber fluorescence entered and occupied the boxed region of interest. Note the differences in both heart rate between control and astemizole-treated hearts as well as the arrhythmic 2:1 atrial:ventricular beat pattern induced by astemizole treatment (lower plot, 30 µM). Blue arrows in panel (d) show missed ventricular beats. Videos available in Supplementary Video S1.
Optimized lighting for non-fluorescent imaging
In addition to its use for fluorescence microscopy, the glowscope frame and clip-on lens can also be useful for viewing non-fluorescent specimens, and has been widely used in some science outreach settings3,4. In our hands, a LED work lamp positioned underneath the specimen worked well for transparent specimens such as zebrafish embryos and larvae (Figs. 1, 2, Supplementary Fig. S2). Acknowledging that transmitted light may be ineffective for viewing non-transparent specimens, we next compared alternative lighting options for both transparent and non-transparent specimens. When viewing specimens such as tadpoles or insects, we found that positioning the light beside or above (epi-illumination) the specimen was advantageous (Supplementary Fig. S2). Either option could be achieved by holding the LED work lamp at the desired position by hand. As a more convenient option for epi-illumination, we re-purposed USB-powered COB LED strip lights (see Supplementary Methods). These inexpensive lights are normally sold for household cabinet and closet lighting and have adhesive (tape) backing, which enabled us to attach them under the plexiglass immediately atop the specimen (Supplementary Fig. S2). These alternative lighting options may be useful when specimen-type versatility is desired but were not necessary for our viewing of embryonic and larval zebrafish.
Use of glowscope devices for science education and outreach
Glowscopes may be suitable for some research applications, but our primary motivator for its development was to meet the needs of science educators and outreach programs. In the United States, recommendations for life science education at the K-12 and undergraduate levels involve increasing hands-on active learning18. These recommendations deemphasize lecture-based information transfer as a sole means for student learning, and instead suggest that students learn science by iteratively performing the scientific method themselves. An inherent challenge of this pedagogical transformation is the increased pressure on teachers to develop new hands-on learning activities that are engaging and support the discipline-based learning goals. The glowscope may be one of many tools that is budget friendly, interests and excites students, and can support hands-on learning in classrooms. To aid its option, videos documenting its use and assembly instruction are available on a glowscopes channel hosted on YouTube at https://www.youtube.com/channel/UCoRglCdvrtqwkBcvP10ibDg.
To assess potential opportunities for its use, we first examined the K-12 Next Generation Science Standards (NGSS). We identified NGSS disciplinary core ideas compatible with glowscope use at grade levels 1, 3, MS (middle school, grades 6–8), and HS (high school, grades 9–12), and developed a table of proposed student learning activities at each of these levels (Supplementary Tables S1–S3). Within these tables, proposed student learning activities rely on glowscopes in different ways. For example, some activities use fluorescence while others use non-fluorescent viewing. Initial use of glowscopes without fluorescence may better prepare users for later fluorescence use, which is more technically challenging. Many activities propose use of zebrafish embryos, but other organisms can be used whether locally collected or purchased from biological suppliers. If use of zebrafish embryos is desired, educators should be aware of www.zfin.org as a means to search for nearby research labs already using zebrafish in their area, which may provide an opportunity for local access to obtain embryos or house adults.
We next performed a series of pilot experiments to provide representative examples of NGSS-compatible student learning activities for STEM education or outreach. In grade 1, NGSS recommends educators involve students in making observations as well as grade-appropriate proficiency in analyzing and interpreting data. We first focused on the specific core ideas addressing how offspring from the same parents can vary in appearance, and the types of behaviors that help offspring survive (Supplementary Fig. S3). In these examples, students use non-fluorescent glowscopes to view animals on a smartphone or tablet display and develop tables to record their observations. To address how offspring behaviors help them to survive, we used a pencil to gently touch the embryos, observe their response, and construct tables for observations and the body parts involved in these observed responses. Although shown for tadpoles and monarch caterpillars (Supplementary Fig. S3), this activity would be compatible with zebrafish or many locally collected insects or worms. Teachers should use discretion as to whether manual dexterity is well developed enough such that students can avoid causing unnecessary harm to the specimens.
An additional question addressed in the Grade 1 core ideas is how animals capture information needed for growth and respond in a way that helps them to survive (Fig. 7a). Zebrafish first obtain the ability to visually observe food, track and strike at moving food (prey), and use their jaw to eat food during their first week of life19,20. Paramecia are a commonly used food source for young zebrafish. These single-celled organisms ‘swim’ in water using cilia to propel their movements. Individuals can be up to 0.5 mm in length and difficult to see with the naked eye, but their movements in petri dishes containing zebrafish larvae were easily observed using a smartphone with clip-on lens (Fig. 7b). Addition of paramecia to the petri dish containing zebrafish increased the frequency of swim events (Fig. 7c–e). We propose students compare non-fed with fed petri dishes (containing paramecia) and observe the types of behaviors and body parts used to respond to the presence of paramecia (Fig. 7f). These responses are essential for growth and survival and involve multiple organismal systems.

Grade 1 student learning activity addressing NGSS core ideas of the animal body parts needed for survival. (a) Description of NGSS standard and proposed student activity. (b) Timecourse (left, gray image series) shows two motile paramecia (blue and black arrows) in the same field of view as a paralyzed zebrafish larva (shown for scale comparison). Color image at right is a maximum intensity time projection, which plots the brightest pixel from each frame in a timelapse video and thereby marks the trajectory of each paramecium (green). Color was added to this image using the texturizer feature in PowerPoint. (c) Outline for student learning activity comparing swim and prey tracking behavior between a dish containing zebrafish larvae without food (paramecium) versus siblings in the presence of paramecia. (d) Timecourse image series shows zebrafish larva in the absence or presence of paramecia in the petri dish. Note the relative lack of movement in controls (upper, dish 1) in comparison to the paramecia treated dish (lower, dish 2). The timecourse shown in (d) represents 33 ms. (e) Graph shows the difference in the frequency of fish larva (5 dpf) swim behavior between groups proposed in (d). N = 4 larvae per condition obtained in one independent experiment; bars show the mean ± standard error; P = 0.0911, paired two-tailed t-test. (f) Example of student observations comparing groups from panel (d), and proposing the body parts involved in the prey tracking behaviors. Images were acquired using an Apple iPhone 12 Pro with (b) and without (d) the clip-on macro lens.
In high school life sciences (grades 9–12), NGSS core ideas focus on genes, inheritance mechanisms, and the effect of both genes and environment on the display of traits. To address the influence of environment on the display of traits, we developed a way to use glowscopes to monitor changes induced by temperature and water acidity. In these learning activities, students can investigate how individual zebrafish show changes to embryonic heart rate in response to these environmental stimuli (Supplementary Fig. S4). We demonstrate simple activities comparing heart rate before and after being placed onto a 35 °C reptile pad for 10 min (Supplementary Fig. S4). Fish may also experience changes to their environment in the form of water acidity. To model this, we added household vinegar to the water and observed decreased heart rate after 25-min immersion in acidic water (Supplementary Fig. S4).
In addition to observing traits and their dependency on genetics and the environment, NGSS core ideas also emphasize mechanisms of genetic inheritance at the high school level (Fig. 8a). Because transgenes are dominant traits and are inherited in Mendelian patterns, the use of zebrafish ‘glow traits’ can be a fun and useful way for students to learn Punnett squares. In this learning activity, students are provided with several petri dishes, each containing embryos from different parental crosses (Fig. 8b). First, students observe each dish and the proportion of offspring displaying the ‘glow trait’. Students then develop Punnett squares for all possible parental genotypes, highlight which offspring genotypes will show dominant phenotypes, and then match their observed data to one or more Punnett squares. Students can then use their models to evaluate and discuss the possible parental genotypes for each dish of offspring.
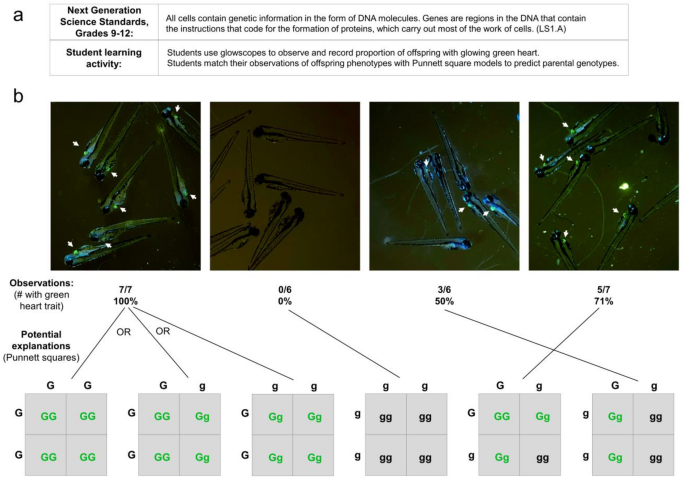
Grades 9–12 NGSS student learning activity focused on genetics and inheritance. (a) Description of NGSS standard and proposed student activity. (b) Representative glowscope fluorescence images of 4 dpf Tg(myl7:EGFP) zebrafish larvae used to determine the proportion inheriting the green heart trait (indicated by white arrows). Tabulated data, each set obtained from a single clutch of zebrafish embryos, are matched to Punnett squares that are consistent with the observed offspring phenotypic ratios. Images were acquired using an Apple iPhone 12 Pro.
link


More Stories
HMD XR21 rugged smartphone, HMD T21 Android tablet launched
Huawei beats Apple again: Claims top spot in the Chinese tablet market
Convert your tablet or smartphone into a touchscreen display for your PC, motherboard, etc… with the AURGA Viewer